Greater Moncton Spring Market: Why Buyers Are Quietly Gaining Ground in 2026
If you’ve been watching the Greater Moncton real estate market and feeling like something has shifted this spring, you’re not imagining it. Nineteen weeks into 2026, the data tells a clear story — one that matters whether you’re thinking of buying, selling, or just keeping tabs on your largest asset.
The headline: inventory is back, and buyers are finally getting some breathing room. Let’s walk through what the numbers actually show.
The Year-to-Date Snapshot
Here’s how the first 19 weeks of 2026 stack up against the same period in 2024 and 2025:
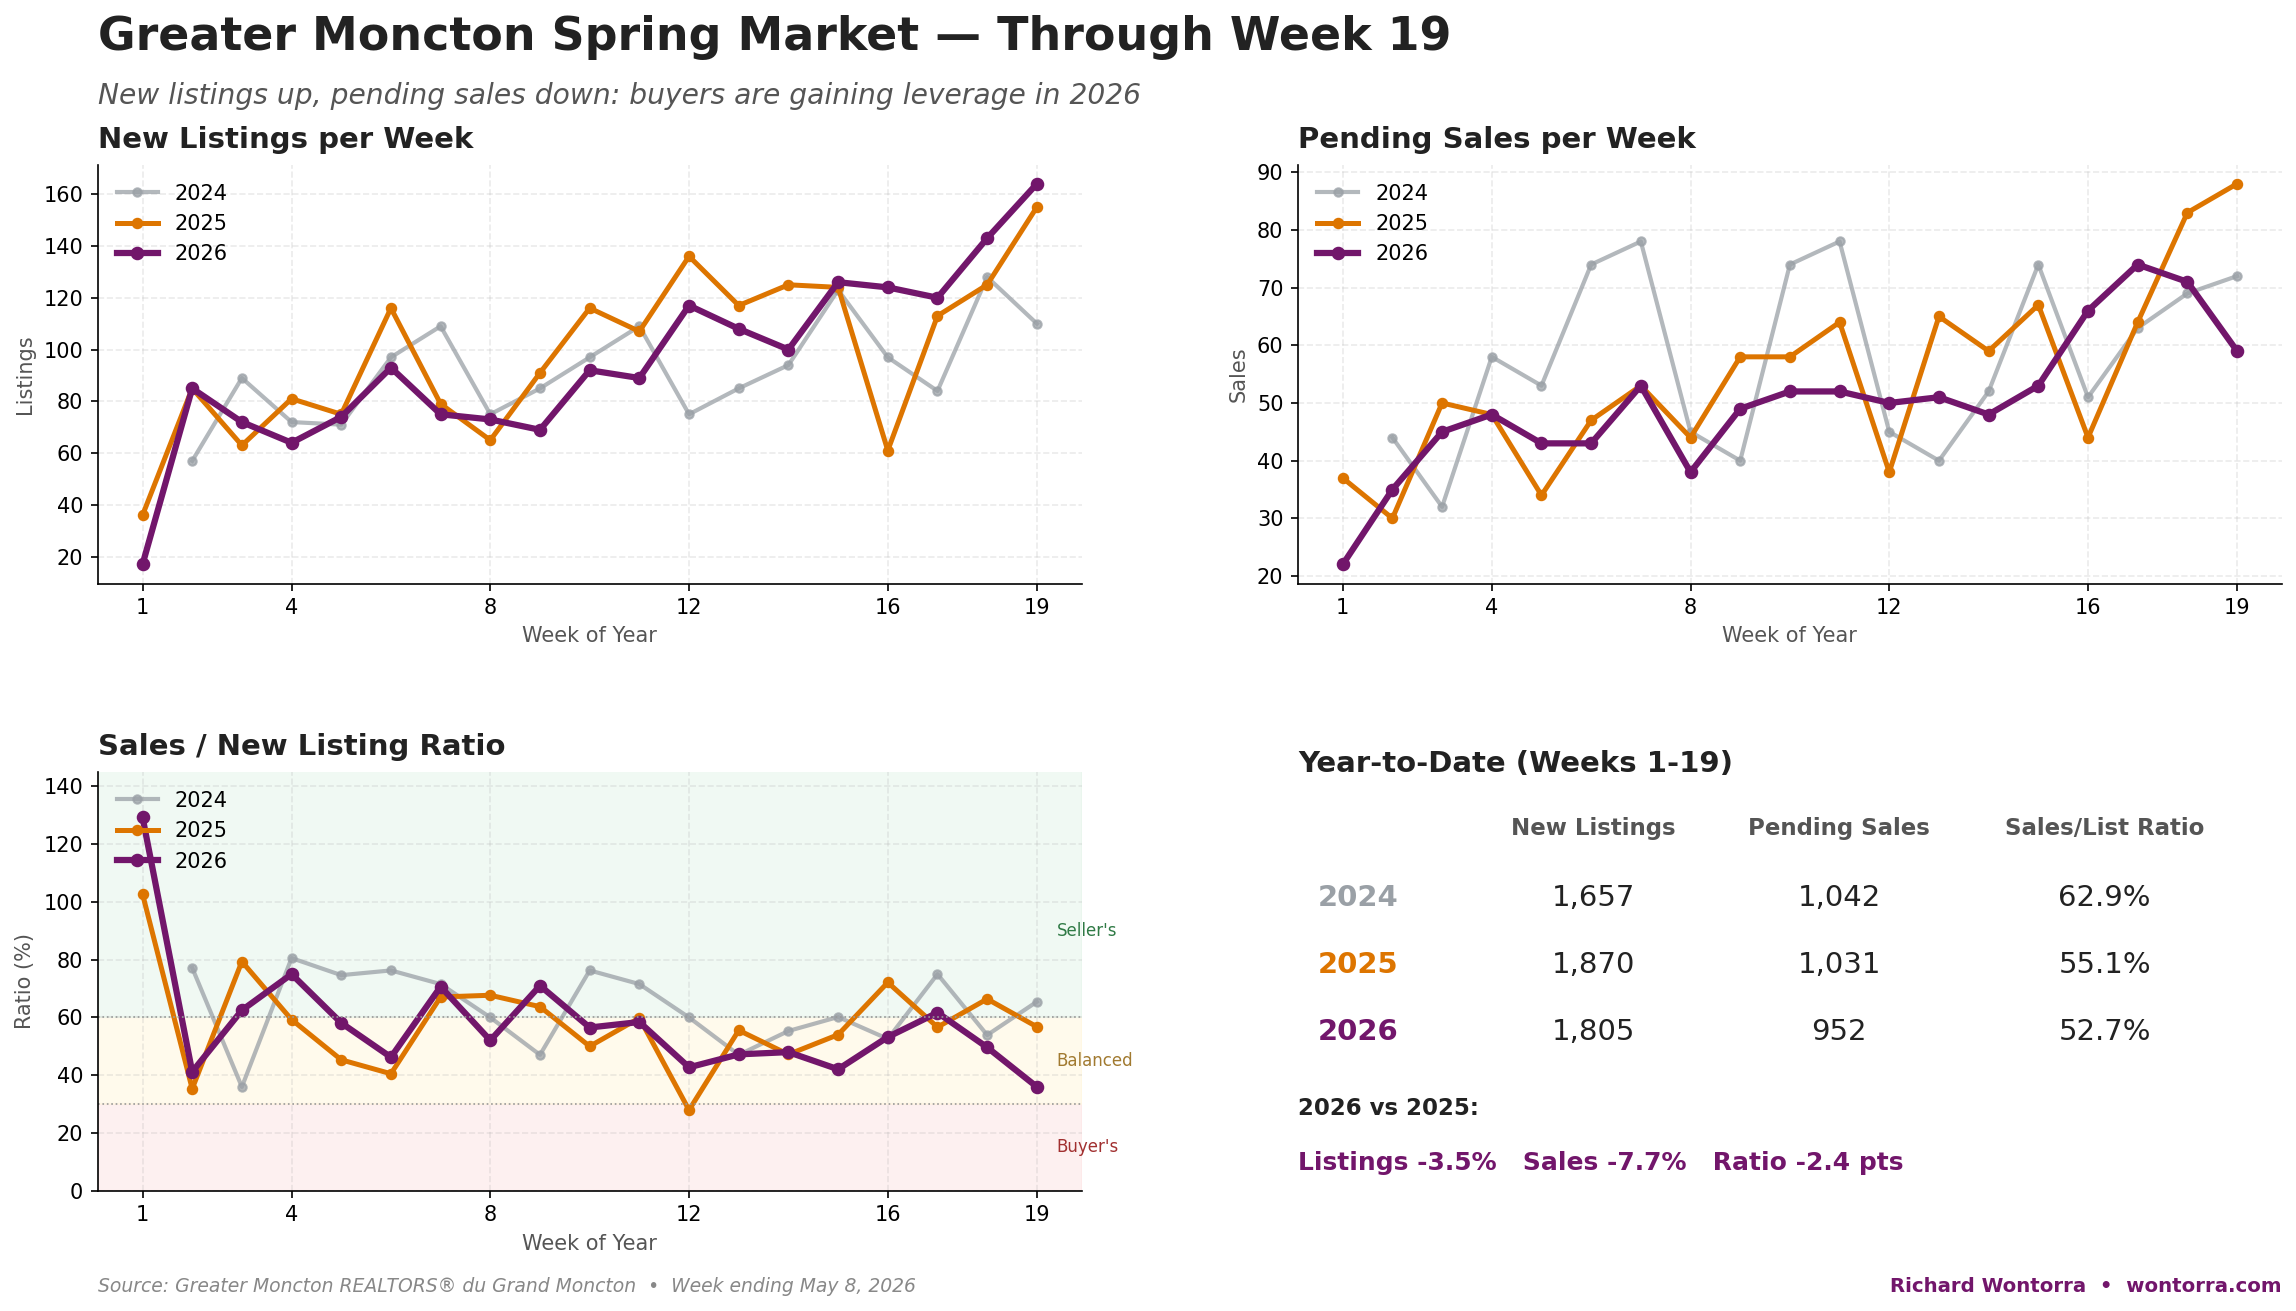
Compared to this point in 2025, new listings are down a modest 3.5%, but pending sales are off by 7.7%. Compared to 2024, listings are up 8.9% while sales are down 8.6%. The pattern is consistent: more homes are coming to market than buyers are absorbing.
The sales-to-listing ratio — one of the cleanest indicators of market balance — has slipped to 52.7%, down from 55.1% last year and well below 2024’s 62.9%. We’re not in buyer’s-market territory yet on a year-to-date basis (that threshold sits at 30%), but we are moving steadily toward a more balanced market, and on a weekly basis we’re already seeing buyer-favourable readings.
What’s Actually Happening Week to Week
The year-to-date numbers smooth out a more dramatic pattern. Look at the last five weeks of new listings in 2026:
- Week 15126 listings
- Week 16124 listings
- Week 17120 listings
- Week 18143 listings
- Week 19164 listings
Week 19 alone produced 164 new listings — more than the same week in 2025 (155) and dramatically more than 2024 (110). Pending sales for that same week? Just 59. That works out to a weekly sales/listing ratio of 36% — squarely in buyer’s-market territory for that snapshot.
The Price Picture
So what’s all this doing to prices? Less than you might expect — at least for now.
The average sale price in Greater Moncton sat at $374,276 in January 2026, down about 3.9% from January 2025’s $389,299. But the median sale price actually edged up slightly: $355,000 in January 2026 versus $350,500 a year earlier — a 1.3% gain.
When the average drops while the median holds, it usually means the mix of homes selling has shifted — fewer high-end transactions pulling the average up. The “typical” home is still trading at roughly the same level. That’s a market in transition, not a market in decline.
Where the Action Is — and Isn’t
The single-family sales data by price band tells an interesting story about which segments have cooled and which are holding firm. Comparing January 2026 to January 2025:
| Price Band | Jan ’25 | Jan ’26 | Change |
|---|---|---|---|
| $200K – $299K | 33 | 36 | +9% |
| $300K – $399K | 65 | 40 | −38% |
| $400K – $499K | 27 | 34 | +26% |
| $500K – $599K | 19 | 19 | 0% |
| $600K – $999K | 11 | 12 | +9% |
The clear soft spot is the $300K–$399K band — historically the bread-and-butter price point in our market. It dropped sharply year over year. Meanwhile, both the entry level and the $400K–$500K range actually grew. Upper-end activity is stable.
What that suggests: buyers in the core mid-range are pausing. Some are trading down to entry-level. Some are stretching up to $400K+ where there’s more inventory and more negotiating room. And many are simply waiting.
If You’re a Buyer Your Move
For the first time in several springs, you have leverage you didn’t have before. Specifically:
- More homes to choose from. Active inventory is the highest it’s been at this point in the calendar in three years.
- Less bidding-war pressure. Subject-free, over-asking offers are no longer the default expectation in many segments.
- Negotiable conditions. Inspection conditions, financing conditions, and even modest price negotiation are increasingly on the table — particularly in the $300K–$500K range.
- Time to be thoughtful. You can actually visit a home twice before deciding. That alone is a meaningful change from 2021–2023.
A note of caution though: “buyer-favourable” doesn’t mean “every home is overpriced.” Well-priced, well-presented homes in desirable Moncton, Riverview, and Dieppe neighbourhoods are still moving briskly — sometimes within days. The shift is happening at the margins, on homes that are slightly mispriced or need work.
If You’re a Seller Adjust the Playbook
If you’re planning to list this spring or summer, the numbers don’t say “don’t sell.” They say price and present like it’s 2026, not 2022.
Three things matter more right now than they did 12 months ago:
- Pricing on day one. Stale listings are accumulating. The first two weeks on market matter enormously — that’s when you have the most attention from the most active buyers. Coming in just 5% high can cost you 60+ days and a price reduction that ends up below where you should have started.
- Presentation and prep. Buyers comparing six homes instead of two are going to notice the dated kitchen, the worn carpet, the cluttered storage room. Cosmetic prep work and professional photos are no longer optional — they’re competitive table stakes.
- Realistic expectations on conditions. Expect inspection conditions. Expect financing conditions. The seller’s-market habit of refusing all conditions has largely faded outside of true premium properties.
Sellers who adapt to this market are still achieving strong results. Sellers who price for last spring’s market are getting frustrated.
The Bigger Picture
It’s worth remembering where Greater Moncton fits in the broader Atlantic Canada story. We had several years of unusually compressed inventory and rapid price acceleration — driven heavily by interprovincial migration, particularly from Ontario. That migration hasn’t stopped, but it has cooled. Local buyers, especially first-time buyers, are returning to a market that for a while was almost impossible for them to compete in.
A 50–55% sales-to-listing ratio isn’t a crisis. It’s actually closer to historical normal than the 70%+ readings we saw during the pandemic-era frenzy. Calling this a “balanced” market is fair. Calling it a “shift toward buyers” is also fair. Both can be true at once.
What you should not do is take this data and conclude that prices are about to fall sharply, or that you should rush to sell before things “collapse.” There’s no signal for that in the data. What there is, is a clear signal that the era of automatic, frictionless seller advantage has eased — at least for now.
Looking Ahead
The next few weeks will tell us a lot. If listings continue to outpace sales at the current rate, the year-to-date ratio will keep drifting downward and we’ll be having a different conversation by mid-summer. If buyer activity picks up — say, in response to mortgage rate movement or seasonal demand — the gap could close again quickly.
I’ll be back with the full April market update shortly, and I’ll continue to track the weekly pattern as we move through the busiest part of the selling season.
If you’re trying to figure out what this means for your specific situation — whether to buy now, sell now, or wait — that’s exactly the conversation I’m here for. There’s no one answer for everyone. But there are good answers for individuals, once we look at your timeline, your numbers, and the specific neighbourhood and price band you’re working in.
📞 506-802-8805 · ✉️ richard@wontorra.com · 🌐 wontorra.com
Source: Greater Moncton REALTORS® du Grand Moncton weekly Market Watch and monthly statistical reports. Data through week ending May 8, 2026.